 RSI Dial
Lesson 5 · Indicators
Stoch RSI, explained
Stochastic RSI is, quite literally, an indicator of an indicator. It takes RSI and asks: where is RSI now, compared with its own range over the last 14 candles? The answer swings between 0 and 100, much faster than RSI itself.
How to read it
- %K (blue): the main line. 100 means RSI is at the top of its recent range, 0 at the bottom.
- %D (orange): a smoothed, slower copy of %K.
- Above 80: overbought. Below 20: oversold.
- The usual signal is %K crossing %D: upwards below 20, or downwards above 80.
Because it reacts so quickly, Stoch RSI is popular with short-term traders. The same speed is also its biggest weakness, as the real example shows.
A real example: Bitcoin, 4-hour chart, 29 October to 18 November 2026
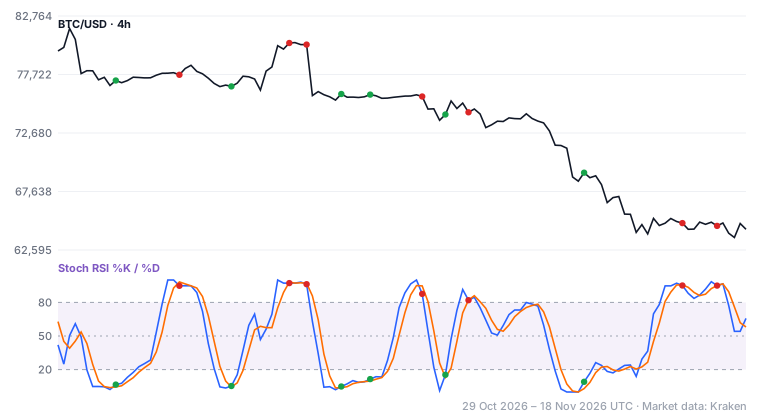
In these three weeks Bitcoin fell from $81,683 to $63,676, about 22% lower. Stoch RSI swung from one end to the other again and again:
- Six times it flashed "oversold" with an upward cross (30 October, 3, 6, 7, 9 and 13 November). Each one looked like a chance to buy the dip, and the price still kept making lower lows.
- In between, it also crossed down from above 80 seven times. Those signals pointed the same way as the trend.
The lesson in one sentence
A fast indicator gives signals in both directions, but in a trend only the ones that point with the trend tend to work. Signals against a strong trend are mostly noise.
Practical tips
- Decide the trend first (for example with MACD or a longer timeframe), then use Stoch RSI only for signals in that direction.
- Expect many signals. On short timeframes it can cross 20 or 80 several times a day.
- Treat it as a timing helper, not as the reason for a trade.
- The standard settings are 14, 14, 3, 3, the same as on TradingView.
Key takeaways
- Stoch RSI shows where RSI sits within its own recent range.
- It is fast, which means early signals and many false ones.
- In a trend, prefer the signals that point with the trend.
- Combine it with a trend tool instead of using it alone.
RSI Dial can alert you to Stoch RSI crosses and zone entries, so you don't have to stare at a 4-hour chart all day.
Get the app All lessons TelegramThis lesson is for education only and is not investment advice. Past price behaviour does not predict future results. Trading involves risk. Market data: Kraken.