 RSI Dial
Lesson 4 · Indicators
Bollinger Bands, explained
Bollinger Bands, created by John Bollinger in the 1980s, draw a channel around the price that widens when the market gets wild and narrows when it calms down. They answer the question: is this price unusual compared with the last few weeks?
How the bands are built
- Middle line: the average closing price of the last 20 candles.
- Upper and lower bands: the middle line plus and minus two "standard deviations", a measure of how much the price has been jumping around.
Most of the time the price stays inside the bands. A close outside them means the move was unusually large for the recent past. %B puts the same idea in one number: 0 is the lower band, 100 the upper band, above 100 or below 0 means outside.
A real example: Bitcoin, July to November 2026
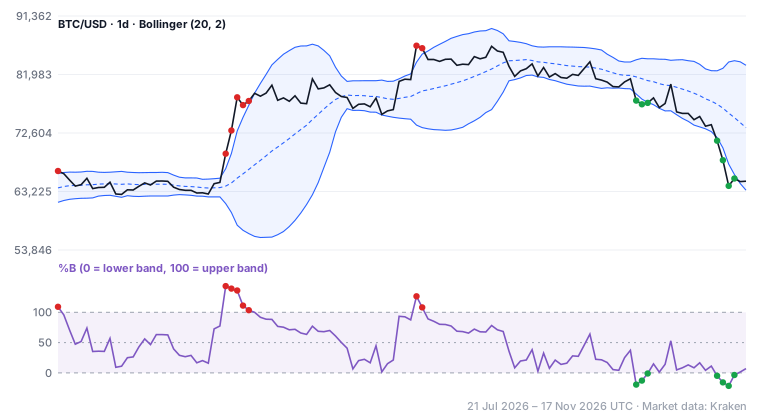
The squeeze (early August). On 15 August the bands were at their narrowest of the whole period: only 4.2% of the price apart. The market had gone quiet. Quiet periods like this often come before a big move, but the bands don't say in which direction.
The breakout and "walking the band" (19–23 August). Four days later Bitcoin broke out upwards and closed above the upper band five days in a row, from $69,285 to $77,738. Touching the upper band was not a reason to sell: in a strong move the price can ride the band for days. By 29 August the bands were 40% of the price apart, almost ten times wider than two weeks earlier.
Below the lower band (12–15 November). During the sharp fall in November, Bitcoin closed below the lower band four days in a row, down to $64,115 on 14 November. Again: a close outside the band says the move is extreme, not that it is over.
The most common mistake
"The price touched the upper band, so it must fall back." Sometimes it does, especially in a sideways market. But the August example shows the opposite: the strongest moves are exactly the ones that stay outside the bands the longest.
Practical tips
- Narrow bands (a squeeze) mean the market is coiling: be ready for a move, in either direction.
- In a sideways market, touches of the bands often turn back toward the middle line.
- In a trending market, the price can walk along one band; a close back inside is often the first sign the move is cooling.
- Combine the bands with RSI or volume to judge whether a breakout has real strength behind it.
Key takeaways
- The bands show what a "normal" price range has been over the last 20 candles.
- A squeeze often comes before a big move, but not its direction.
- A close outside the bands means an unusually strong move, not an automatic reversal.
- %B tells you where the price sits inside the bands, as one number.
RSI Dial can alert you when the price breaks above or below the Bollinger Bands, or comes back inside them, on the timeframe you choose.
Get the app Next lesson: Stoch RSI → TelegramThis lesson is for education only and is not investment advice. Past price behaviour does not predict future results. Trading involves risk. Market data: Kraken.