 RSI Dial
Lesson 3 · Indicators
MACD, explained simply
MACD (Moving Average Convergence Divergence) is a trend-following indicator. Where RSI tells you how stretched a move is, MACD tells you which way the trend is pointing and whether it is gaining or losing speed.
The three parts
- MACD line (blue): the gap between a fast average of the price (12 candles) and a slow one (26 candles). Above zero, the short-term trend is up. Below zero, it's down.
- Signal line (orange): an average of the MACD line itself (9 candles). It moves more slowly.
- Histogram (bars): the distance between the two lines. Growing bars mean the move is speeding up, shrinking bars mean it is slowing down.
The classic signal is the crossover: the MACD line crossing above the signal line (bullish) or below it (bearish).
A real example: Nvidia, July to November 2026
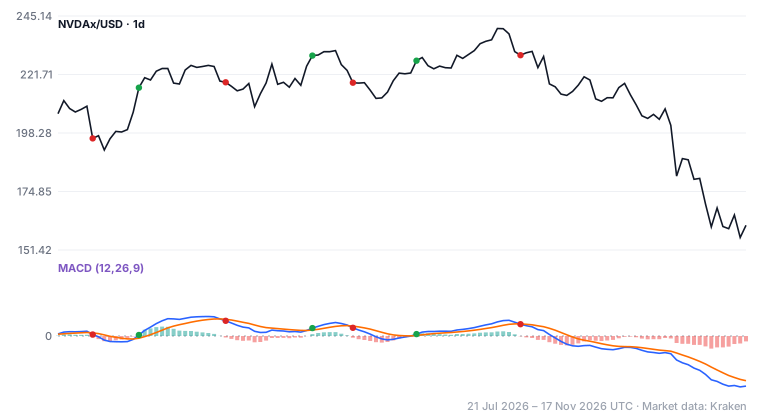
August to early October: a sideways market, mixed results. While Nvidia moved up and down between roughly $200 and $240, MACD crossed back and forth:
- Bullish cross on 3 September at $229.27, bearish cross on 10 September at $218.41: the price was almost 5% lower by the time the "sell" cross came.
- Bullish cross on 21 September at $227.22, bearish cross on 9 October at $229.43: practically flat, even though the price closed as high as $240.12 in between.
October to November: a trend, and one signal that mattered. The bearish cross on 9 October came with Nvidia at $229.43. After it, MACD stayed below its signal line all the way to 17 November, while the price fell to $161.33, about 30% lower. One crossover, one long move.
Why MACD behaves like this
MACD is built from moving averages, so it is always a little late. In a strong trend, being late doesn't matter much: you still catch most of the move. In a sideways market, the price turns before MACD does, and crossovers keep arriving just after the move is over. These failed signals are called "whipsaws".
Practical tips
- Check whether the market is trending or moving sideways before trusting a crossover.
- Crossovers above the zero line (bullish) or below it (bearish) go with the bigger trend and are usually stronger.
- A shrinking histogram warns that a move is slowing down, often before the actual crossover.
- MACD works well together with RSI: RSI shows the extremes, MACD shows the direction.
Key takeaways
- MACD shows the direction and speed of a trend.
- The crossover of the MACD and signal lines is the classic signal.
- It shines in trends and gives many false signals in sideways markets.
- The histogram shows whether a move is speeding up or slowing down.
RSI Dial can alert you to every MACD crossover on the coins and stocks you follow, on the timeframe you choose.
Get the app Next lesson: Bollinger Bands → TelegramThis lesson is for education only and is not investment advice. Past price behaviour does not predict future results. Trading involves risk. Nvidia is used only as an example; NVDAx is Kraken's tokenized stock that tracks it. Market data: Kraken.