 RSI Dial
Lesson 1 · Indicators
What is RSI? A plain-English guide
RSI, the Relative Strength Index, is the most popular momentum indicator in trading. It was created by J. Welles Wilder in 1978 and it answers one simple question: how strong has the recent move been?
What RSI measures
RSI looks at the last few candles (14 by default) and compares the size of the up moves with the size of the down moves. The result is a number between 0 and 100:
- If most of the recent movement was up, RSI is high.
- If most of it was down, RSI is low.
- Around 50, buyers and sellers have been roughly balanced.
It doesn't care about the price itself (a coin at $0.10 and one at $60,000 use the same scale), only about how one-sided the recent moves were.
The 70 and 30 levels
Two lines are drawn on almost every RSI chart:
- Above 70: "overbought". The move up has been unusually strong.
- Below 30: "oversold". The move down has been unusually strong.
"Overbought" sounds like "about to fall", but that is not what it means. It means the market has been running hot. Sometimes that ends in a pullback, and sometimes it is the start of a powerful trend. The real example below shows both.
A real example: Bitcoin, July to November 2026
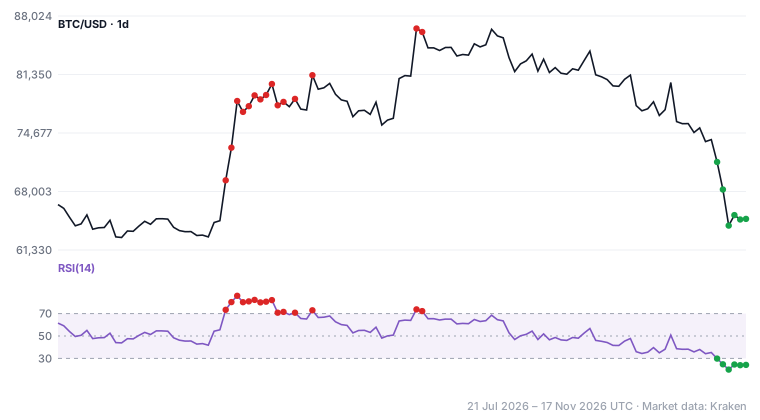
August: overbought for two weeks, and the price kept rising. RSI crossed above 70 on 19 August with Bitcoin at $69,285. It stayed at or above 70 on almost every day until 3 September, peaking at 85.9. During that time the price did not fall. It climbed another 17%, to $81,276. Anyone who treated the first "overbought" reading as a sell signal missed the whole move.
September: a higher price, a weaker RSI. On 21 September Bitcoin made its highest close of the period, $86,594. RSI touched 73.8, clearly lower than the 85.9 of August, even though the price was higher. The move up was losing strength. This pattern is called a divergence, and it's the topic of our next lesson. Over the following weeks the price slid to $64,115.
November: oversold. From 12 November RSI dropped below 30, reaching 20.0 on 14 November. The move down had become unusually strong. As with overbought, this isn't a promise of a bounce. It's a sign that the market is stretched and worth watching closely.
Hindsight is easy
Looking back at a chart, every signal seems obvious. In real time you never know whether an overbought reading is the top or the beginning of a strong trend. That's why traders combine RSI with other clues (trend, volume, other timeframes) instead of using it alone.
Three common mistakes
- Selling just because RSI is above 70. In strong uptrends RSI can stay overbought for weeks, as in August above.
- Buying just because RSI is below 30. In a crash RSI can stay oversold while the price keeps falling.
- Watching only one timeframe. RSI can be oversold on the 1-hour chart and perfectly neutral on the daily one. The longer timeframe usually tells you more about the bigger picture.
Which settings to use
- Period 14 is the standard and a good starting point.
- Shorter periods (for example 6) react faster but give many more signals. With them, many traders use 20 and 80 instead of 30 and 70.
- Timeframe: short timeframes (minutes) suit active traders, while 4-hour and daily candles suit people who don't want to watch the screen all day.
Key takeaways
- RSI measures how one-sided recent price moves were, from 0 to 100.
- Above 70 is "overbought", below 30 is "oversold". Neither is a buy or sell order.
- In strong trends RSI can stay at an extreme for a long time.
- A higher price with a lower RSI (a divergence) can be an early sign that a move is tiring.
RSI Dial watches RSI for you, on the coins, stocks, levels and timeframes you choose, and alerts you the moment it gets there.
Get the app Next lesson: RSI divergence → TelegramThis lesson is for education only and is not investment advice. Past price behaviour does not predict future results. Trading involves risk. Market data: Kraken.