 RSI Dial
Lesson 2 · Indicators
RSI divergence, explained
In lesson 1 we saw that RSI measures how strong recent moves have been. A divergence happens when the price and RSI tell two different stories: the price makes a new high (or low), but RSI doesn't follow.
The two kinds
- Bearish divergence: the price makes a higher high, but RSI makes a lower high. The price is still rising, but each push up has less force behind it.
- Bullish divergence: the price makes a lower low, but RSI makes a higher low. The price is still falling, but the selling is getting weaker.
Think of a car going uphill: it can still be climbing while the engine is already losing power. A divergence is the sound of the engine.
A real example: Bitcoin in August and September 2026
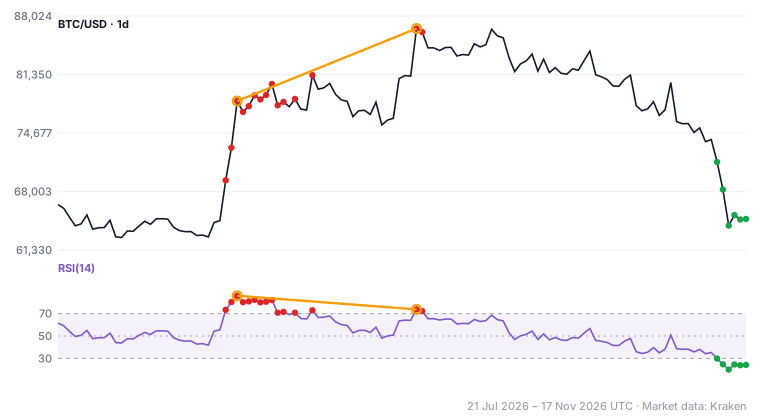
- 21 August: Bitcoin closed at $78,327 with RSI at 85.9, a very strong move.
- 21 September: Bitcoin closed at $86,594, about 10.6% higher. But RSI reached only 73.8, about 12 points lower.
Higher price, weaker momentum: a textbook bearish divergence. In the weeks that followed, Bitcoin fell to $64,115 by 14 November.
Notice the timing
The divergence did not mark the top on the first day. Between the two highs the price still rose by more than 10%. A divergence tells you a move is tiring, not when it will turn. Sometimes it never turns, and the divergence simply fades away.
How to spot one
- Compare two clear peaks (or two clear dips) on the price chart, not every small wiggle.
- Look at RSI at the same two points. If the price and RSI point in opposite directions, you have a divergence.
- It usually means more when RSI was in an extreme zone at the first peak (above 70) or dip (below 30).
- Divergences on daily or 4-hour charts usually matter more than those on 5-minute charts, which come and go all the time.
How traders use it
Most traders treat a divergence as a warning, not as a trigger. They wait for confirmation, such as the price breaking below a recent low, a MACD cross, or the higher timeframe turning too. And they plan for the case where the warning turns out to be wrong.
Key takeaways
- A divergence is when the price and RSI disagree about a new high or low.
- Bearish: higher price high, lower RSI high. Bullish: lower price low, higher RSI low.
- It is an early warning that momentum is fading, not a timing tool.
- Bigger timeframes give more meaningful divergences.
Set an RSI alert in RSI Dial and you'll know the moment RSI reaches an extreme, so you can check the chart for a divergence yourself.
Get the app Next lesson: MACD → TelegramThis lesson is for education only and is not investment advice. Past price behaviour does not predict future results. Trading involves risk. Market data: Kraken.